LNOB Tree Example
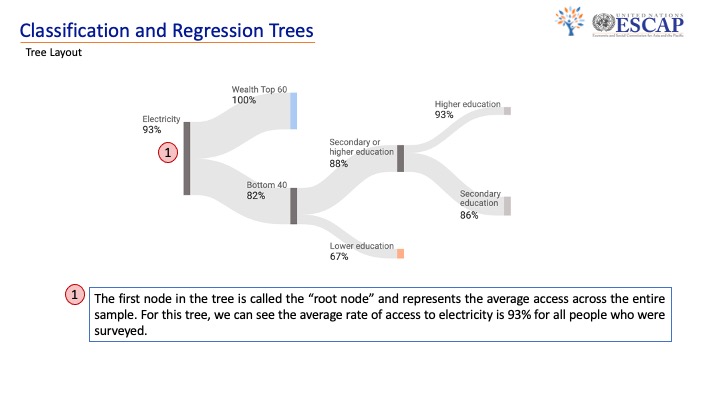
Here we can see a real example of our LNOB Trees. We hope that these trees are simpler to read and more aesthetic compared to the trees directly from R. From this tree we can see that the first node, what we call the “root” node represents the average access across the entire sample. In this case we are looking at access to electricity. This node would calculate the average access rate of the entire country, or the entire province depending on the population we are looking at.