Feature Space Diagram
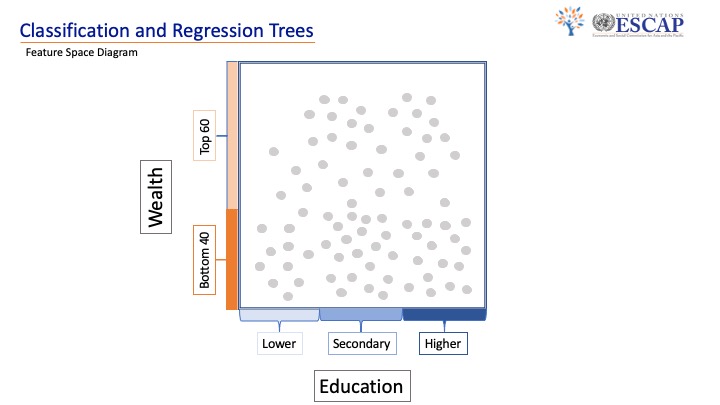
Next I will take you through the same example using a feature space diagram. This is just another way to visualize the way the algorithm works. We will keep it simple by only considering two circumstances, otherwise I would need a 3D interactive program to show you how many different circumstances are included. In this diagram all of the grey dots are considered our survey population. In this case since we are looking at access to electricity they represent households.