Methodology
Leaving No One Behind(LNOB):
A methodology to identify those furthest behind in Asia and the Pacific

With the adoption of the 2030 Agenda for Sustainable Development, the United Nations Member States pledged to reduce inequality in all its forms through Sustainable Development Goal 10, while ensuring that “no one will be left behind.”
The LNOB methodology is an innovative tool that can deliver on this promise. It helps policymakers and practitioners measure inequality of opportunity, using data from nationally representative household surveys such as:
- Demographic and Health Surveys (DHS)
- The Multiple Indicator Cluster Surveys (MICS).
This platform presents an innovative approach using the Classification and Regression Tree (CART) methodology and the Dissimilarity Index (D-index) to identify households and individuals furthest behind in access to basic opportunities in the Asia-Pacific region.
Regression trees offer a practical way of operationalizing the LNOB pledge, while the D-index allows a comparison of inequality of opportunity levels within and between indicators, countries and over time.
Together, these tools can help design inclusive policies and strategies to accelerate progress toward the 2030 Agenda for Sustainable Development.
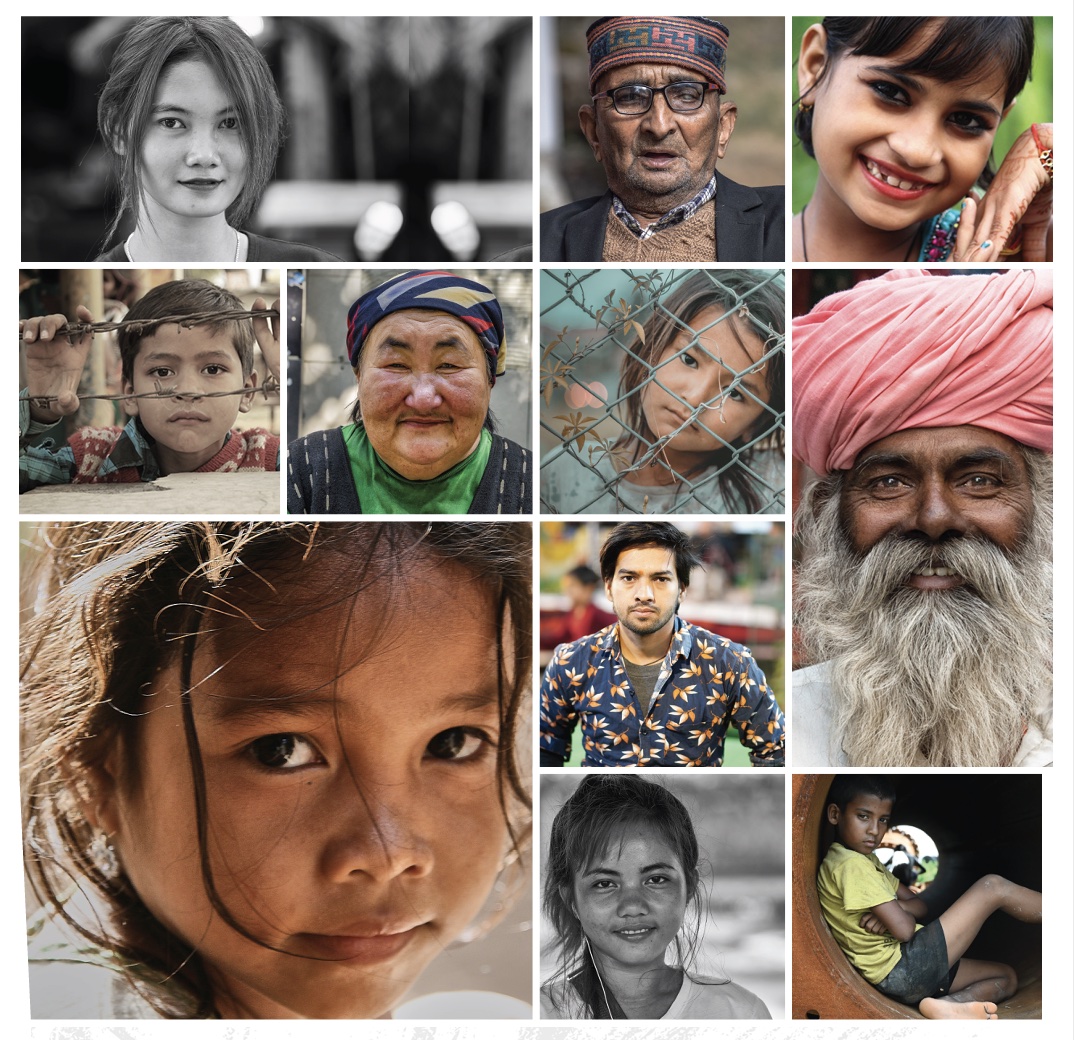
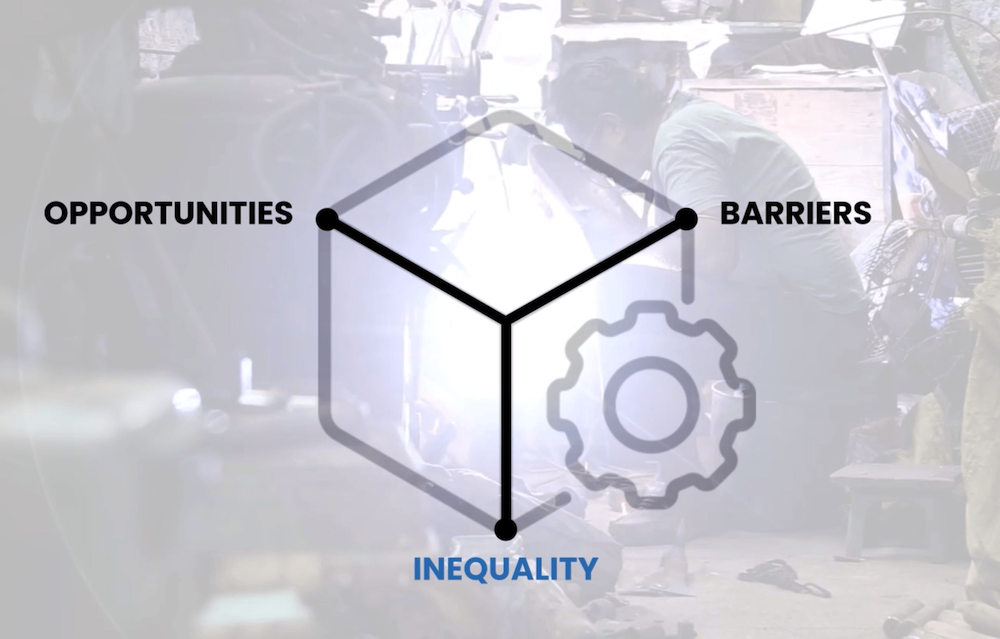
From household to individual, the opportunities and barriers on this platform have been identified as areas where inequality jeopardizes a person’s life prospects. All of them are covered by specific Sustainable Development Goals.
The indicators can be divided into two groups: opportunities and barriers.
- Basic Resources
- Basic drinking water
- Basic sanitation services
- Clean fuel
- Electricity
- Internet use
- Mobile Phone
- Women’s Health
- Skilled birth assistance
- Modern contraceptives
- Education
- Early childhood education
- Secondary and higher education
- Financial
- Bank account ownership
- Use of financial services
For opportunities, the ultimate goal is to achieve universal access at 100 per cent coverage for all households or individuals.
- Malnutrition in children
- Stunting
- Overweight and wasting
- Violence Against Women
- Physical, sexual or emotional violence (by intimate partner in the past 12 months)
- attitudes toward violence against women
For barriers, the ultimate goal is to achieve zero incidents.
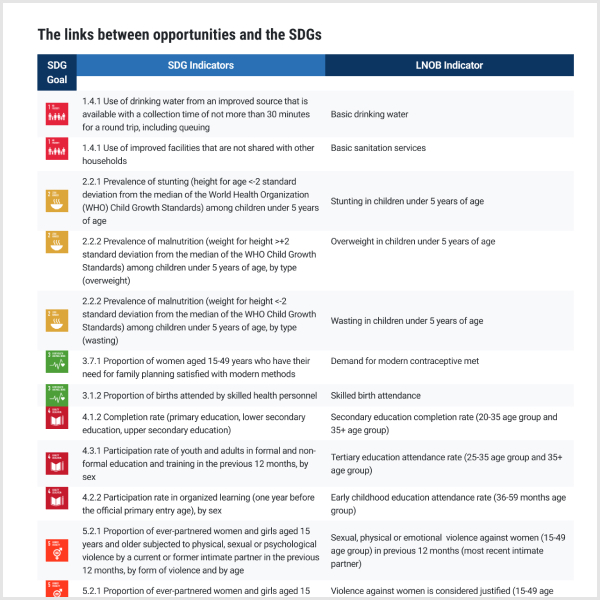
From household to individual, the opportunities and barriers on this platform have been identified as areas where inequality jeopardizes a person’s life prospects. All of them are covered by specific Sustainable Development Goals.
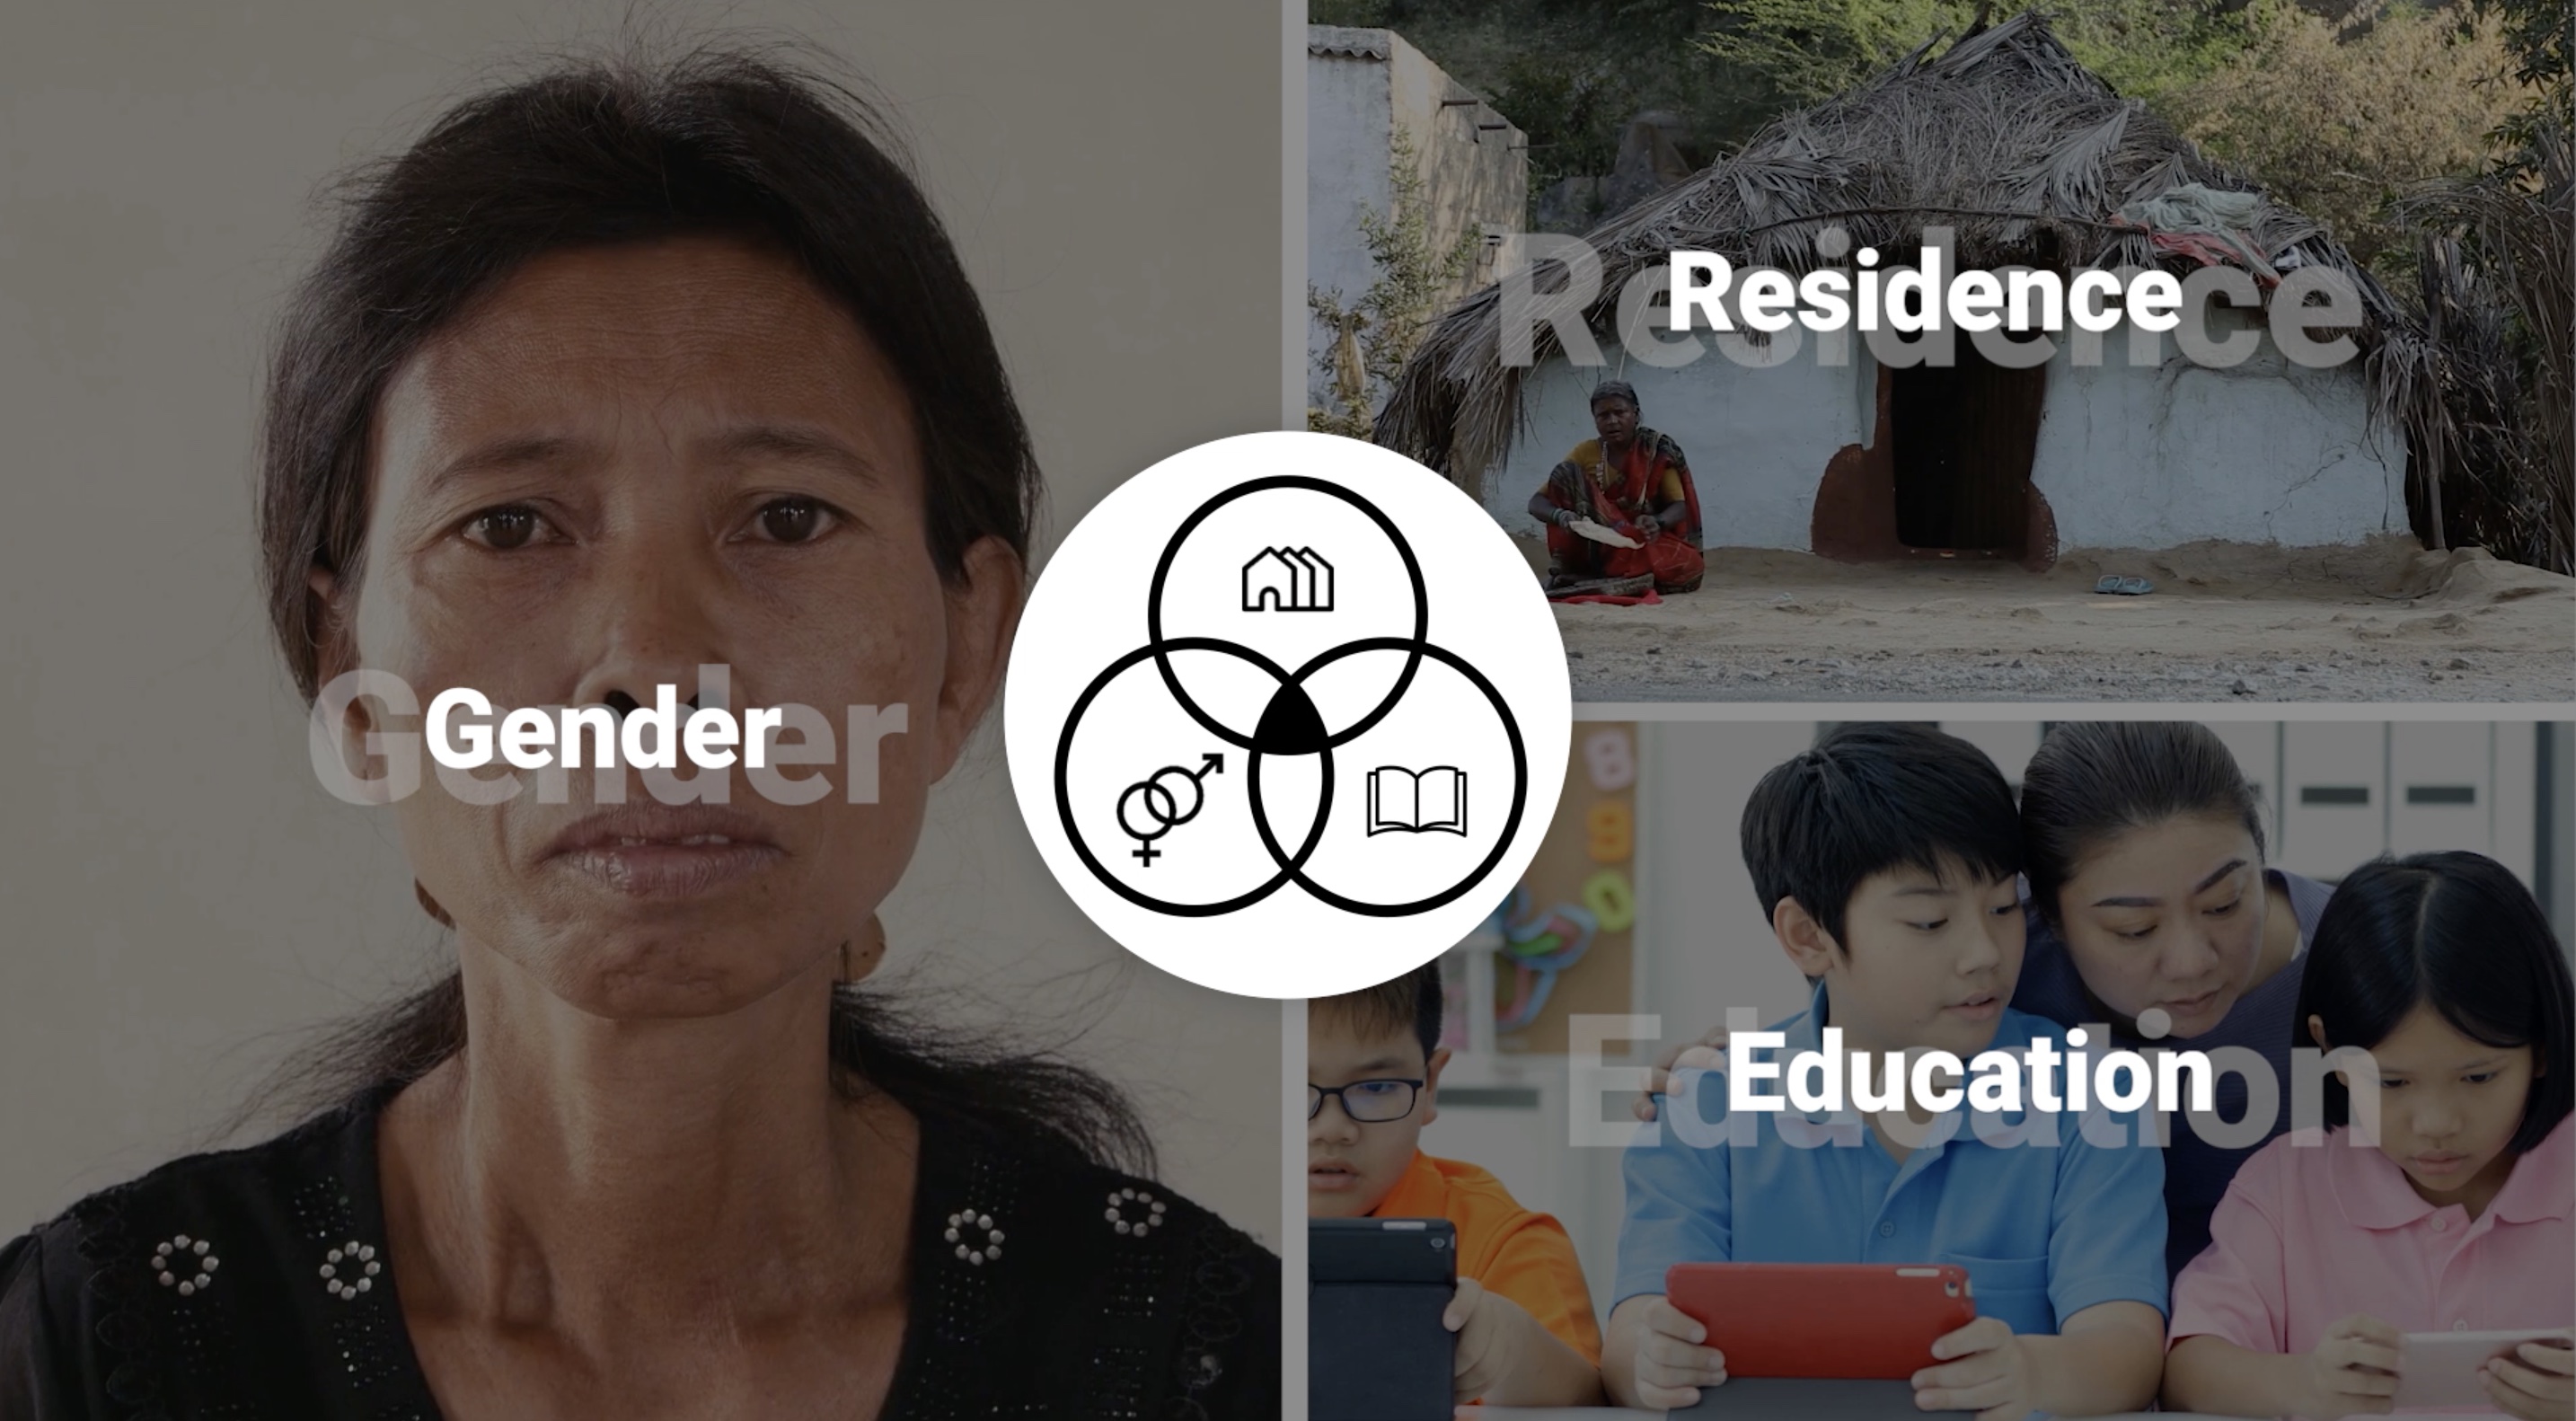
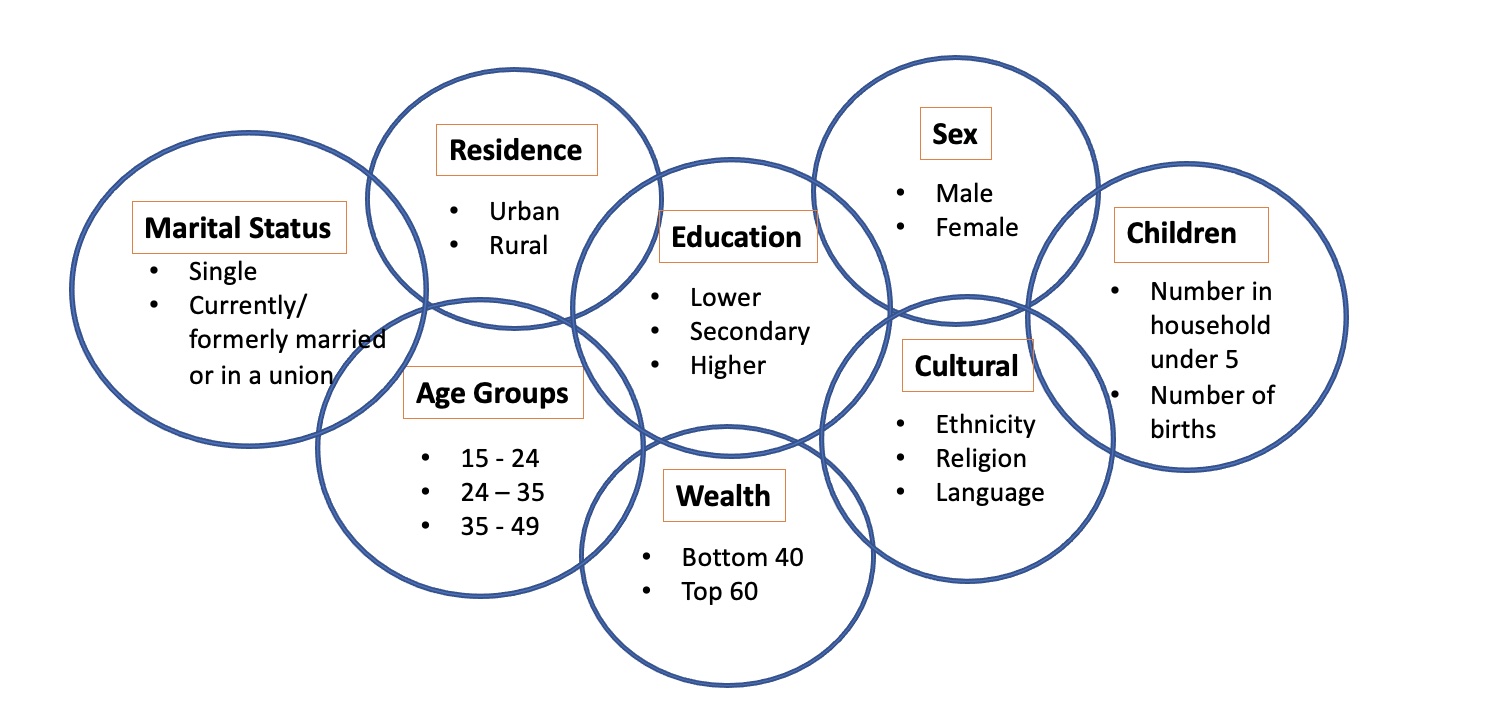
To measure gaps among groups in access to or prevalence of our defined indicators, a set of circumstances as shown in Venn diagram above are selected from available variables in the DHS and MICS datasets to define the groups. Different sets of circumstances are used for different outcomes based on a review of rigorous empirical studies.
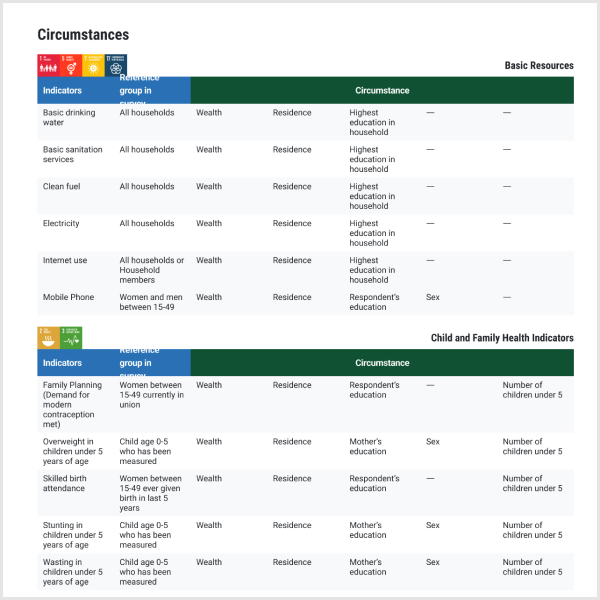
These circumstances are usually a set of background characteristics reflecting demographic and socioeconomic conditions that the individuals or the households have little control over at the time when the outcomes are measured.
The selection of variables is consistent across all surveys to maintain comparability across countries. They are also in line with the nature of disaggregation called for in the 2030 Agenda for Sustainable Development.
These circumstances also define the composition of the groups, whose access to opportunities is measured. For example, rural women are one of the possible groups created when considering the circumstances residence and sex.
However, circumstances should not be interpreted as ‘causes’ of inequality, but rather correlates.
Furthermore, there are many other factors that could be informative in building the LNOB trees but availability of data is often a binding constraint. It is also worth nothing that inclusion of circumstances must go through a rigorous consideration. Including circumstances that are highly correlated with one another (i.e. multicolliniearity) can bias the estimation. Including circumstances that are endogenous (i.e. simultaneously determined with outcome, driven by other factors or reversely caused by outcome) can also bias the estimation.
Consequently, LNOB trees often use few but reliable circumstances.
Knowing that inequality of opportunity is broadly associated with specific circumstances opens the door to deeper exploration of the data, to understand why and by how much some population groups are at disadvantage, while others are at an advantage. This is the primary goal of the CART algorithm.
Identifying these groups help policymakers to focus their interventions at both national and subnational levels.
The Dissimilarity Index, or the D-index, measures how unequally access to an opportunity is among population groups. It measures how different groups formed by the intersection of selected circumstances such as sex, age, education and wealth fare in terms of access to a certain opportunity.
Like the Gini coefficient, the D-index ranges from 0 to 1, where 0 indicates no inequality, or that the access is randomly distributed among people or households.
One (1), on the other hand, indicates that the entire access is reserved to one specific population group with shared circumstances (e.g. men from urban areas). Two countries with identical average access rates may therefore have very different D-indices if the access in one country excludes certain groups (such as females, poorer groups, or ethnic minorities).
The D-index is a weighted average of the absolute difference of all relevant groups from the average access rate in the country (𝑝̅) and is calculated using the formula:
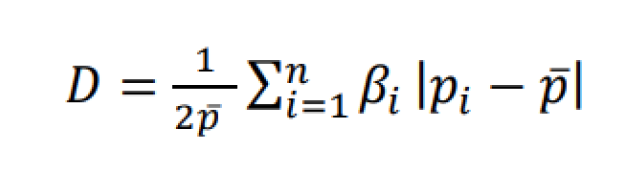
where 𝛽𝑖 is the weighted sampling proportion of the population group i, (the sum of all 𝛽𝑖 equals 1), 𝑝̅ is the average access rate in the country and 𝑝𝑖 is the level of access of population group 𝑖 and takes values from 0 to 1.